|
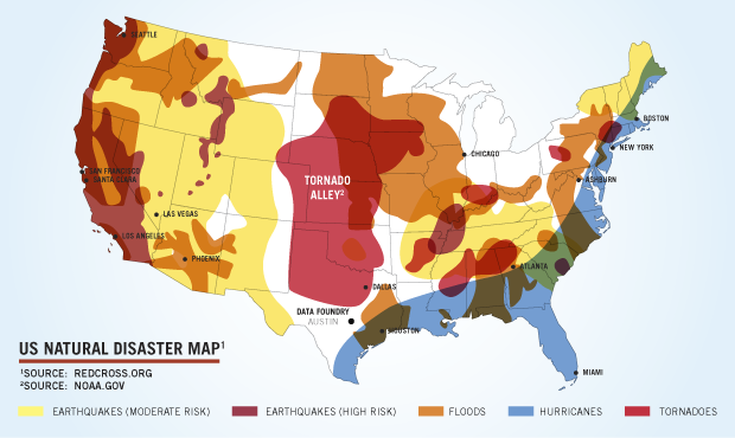
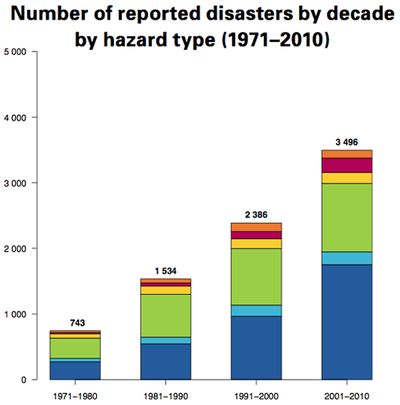
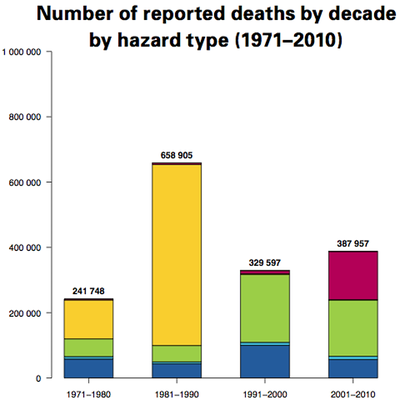
Everyone has heard of different natural disasters in one point in time. If you look at the map below, I'm from Maryland, right in the edge of the hurricane section. Needless to say, almost everyone in the United States has witnessed some form of a natural disaster. The map above leaves out wild fires but Jill lives out in the west where it's most prone to them and we're going to let her talk about them more closely. The graphs below show the change of natural disaster trends over the past 40 years, the left being the number of disasters per decade, also split into type and the right shows deaths caused by each type also spread over the past 40 years. Natural disasters don't only affect the local area but also have a nation-wide effect. For example, Hurricane Katrina devastated southern states; it was estimated that more than 10% of Mississippi's cotton crops were destroyed. Gas prices shot up to $6-$8 in some of the lower states on Labor Day weekend and more northern states received a 40-70 cent jump. Luckily, the United States showed their unity and launched dozens of campaigns to help pay for the rebuild, recover and regrowth of the affected areas. The more we allow climate change to occur the more natural disasters will be caused. Sources:
0 Comments
Leave a Reply. |
Categories
All
Archives
March 2024
|


 RSS Feed
